2025

Skeptik: A Hybrid Framework for Combating Potential Misinformation in Journalism
Arlen Fan*, Fan Lei*, Steven R. Corman, Ross Maciejewski (* equal contribution)
ACM Transactions on Interactive Intelligent Systems (TiiS), to appear 2025
The proliferation of misinformation in journalism, often stemming from flawed reasoning and logical fallacies, poses significant challenges to public understanding and trust in news media. Traditional fact-checking methods, while valuable, are insufficient for detecting the subtle logical inconsistencies that can mislead readers within seemingly factual content. To address this gap, we introduce Skeptik, a hybrid framework that integrates Large Language Models (LLMs) with heuristic approaches to analyze and annotate potential logical fallacies and reasoning errors in online news articles. Operating as a web browser extension, Skeptik automatically highlights sentences that may contain logical fallacies, provides detailed explanations, and offers multi-layered interventions to help readers critically assess the information presented. The system is designed to be extensible, accommodating a wide range of fallacy types and adapting to evolving misinformation tactics. Through comprehensive case studies, quantitative analyses, usability experiments, and expert evaluations, we demonstrate the effectiveness of Skeptik in enhancing readers' critical examination of news content and promoting media literacy. Our contributions include the development of an expandable classification system for logical fallacies, the innovative integration of LLMs for real-time analysis and annotation, and the creation of an interactive user interface that fosters user engagement and close reading. By emphasizing the logical integrity of textual content rather than relying solely on factual accuracy, Skeptik offers a comprehensive solution to combat potential misinformation in journalism. Ultimately, our framework aims to improve critical reading and protect the public from deceptive information online and enhance the overall credibility of news media.
MapIQ: Benchmarking Multimodal Large Language Models for Map Question Answering
Varun Srivastava, Fan Lei, Srija Mukhopadhyay, Vivek Gupta, Ross Maciejewski
Conference on Language Modeling (COLM 2025) 2025
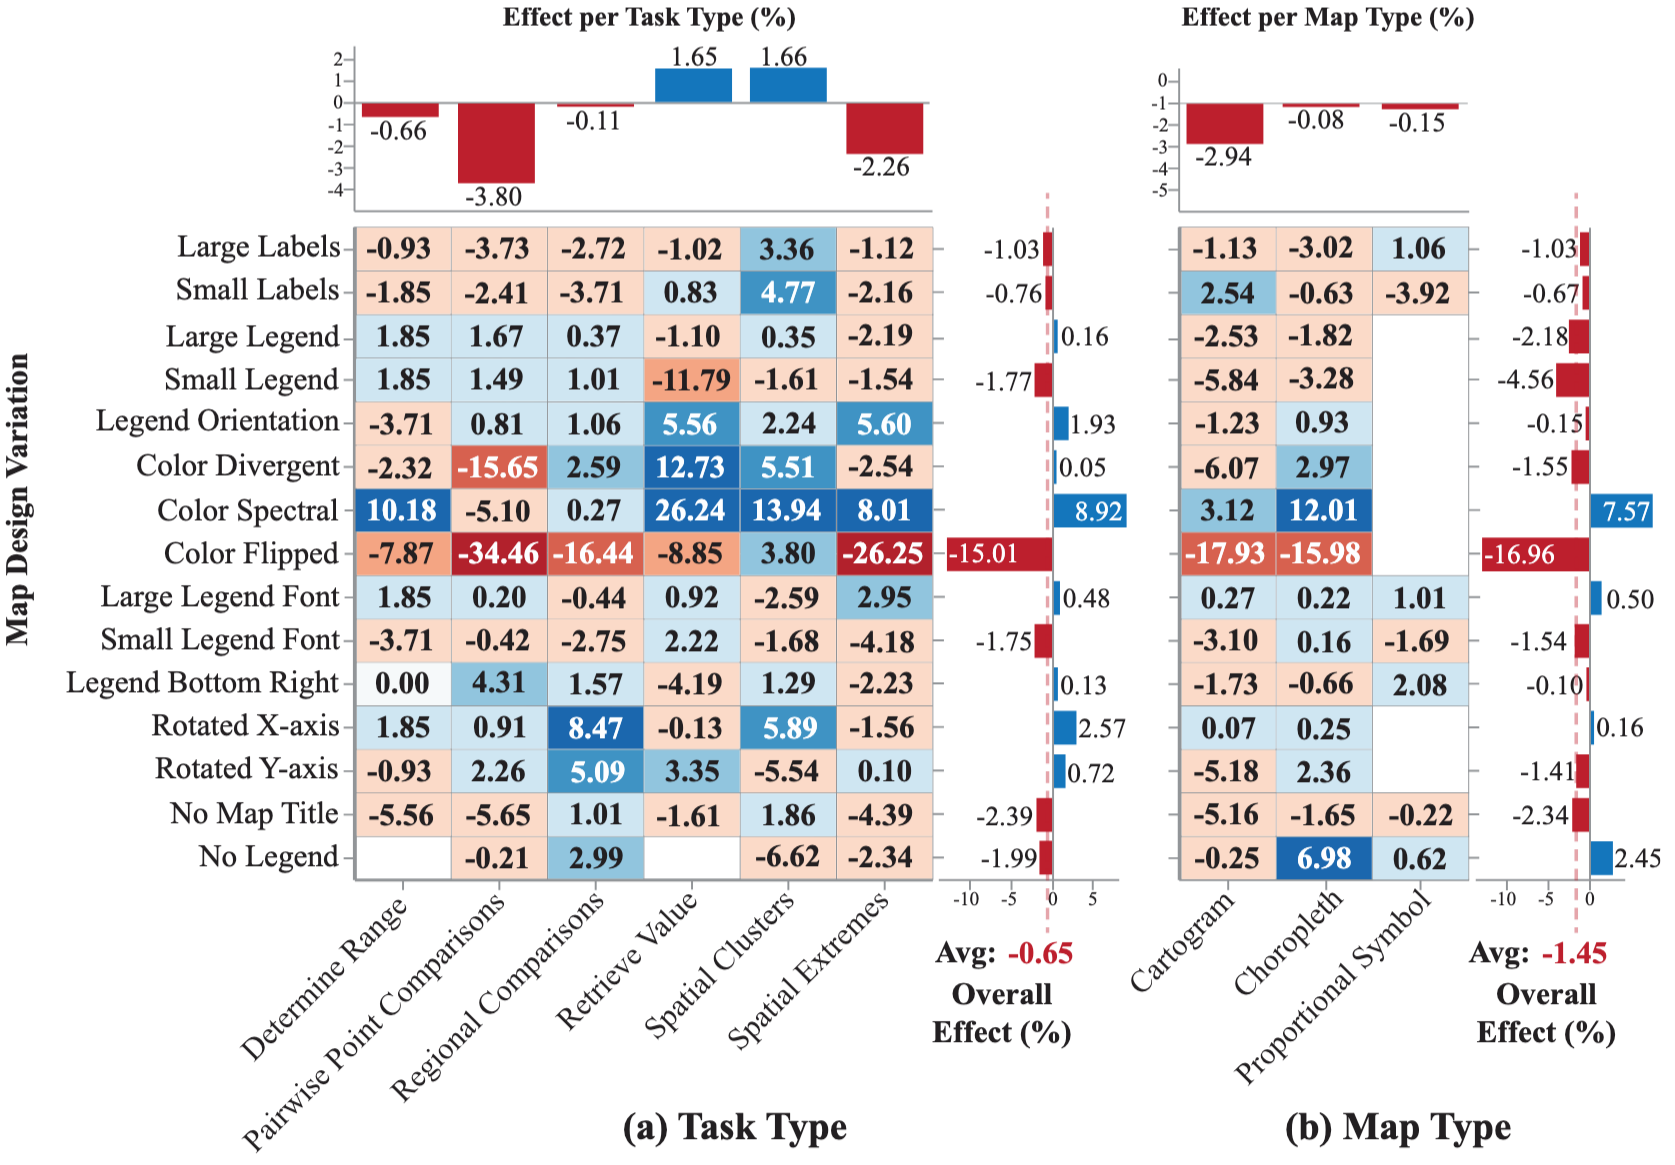
Recent advancements in multimodal large language models (MLLMs) have driven researchers to explore how well these models read data visualizations, e.g., bar charts, scatter plots. More recently, attention has shifted to visual question answering with maps (Map-VQA). However, Map-VQA research has primarily focused on choropleth maps, which cover only a limited range of thematic categories and visual analytical tasks. To address these gaps, we introduce MapIQ, a benchmark dataset comprising 14,706 question-answer pairs across three map types: choropleth maps, cartograms, and proportional symbol maps spanning topics from six distinct themes (e.g., housing, crime). We evaluate multiple MLLMs using six visual analytical tasks, comparing their performance against one another and a human baseline. An additional experiment examining the impact of map design changes (e.g., altered color schemes, modified legend designs, and removal of map elements) provides insights into the robustness and sensitivity of MLLMs, their reliance on internal geographic knowledge, and potential avenues for improving Map-VQA performance.
MapIQ: Benchmarking Multimodal Large Language Models for Map Question Answering
Varun Srivastava, Fan Lei, Srija Mukhopadhyay, Vivek Gupta, Ross Maciejewski
Conference on Language Modeling (COLM 2025) 2025
Recent advancements in multimodal large language models (MLLMs) have driven researchers to explore how well these models read data visualizations, e.g., bar charts, scatter plots. More recently, attention has shifted to visual question answering with maps (Map-VQA). However, Map-VQA research has primarily focused on choropleth maps, which cover only a limited range of thematic categories and visual analytical tasks. To address these gaps, we introduce MapIQ, a benchmark dataset comprising 14,706 question-answer pairs across three map types: choropleth maps, cartograms, and proportional symbol maps spanning topics from six distinct themes (e.g., housing, crime). We evaluate multiple MLLMs using six visual analytical tasks, comparing their performance against one another and a human baseline. An additional experiment examining the impact of map design changes (e.g., altered color schemes, modified legend designs, and removal of map elements) provides insights into the robustness and sensitivity of MLLMs, their reliance on internal geographic knowledge, and potential avenues for improving Map-VQA performance.
FEWSim: A Visual Analytic Framework for Exploring the Nexus of Food-Energy-Water Simulations
Fan Lei, David A. Sampson, Jiayi Hong, Yuxin Ma, Giuseppe Mascaro, Dave White, Rimjhim Agarwal, Ross Maciejewski
IEEE Computer Graphics and Applications (CG&A), to appear 2025
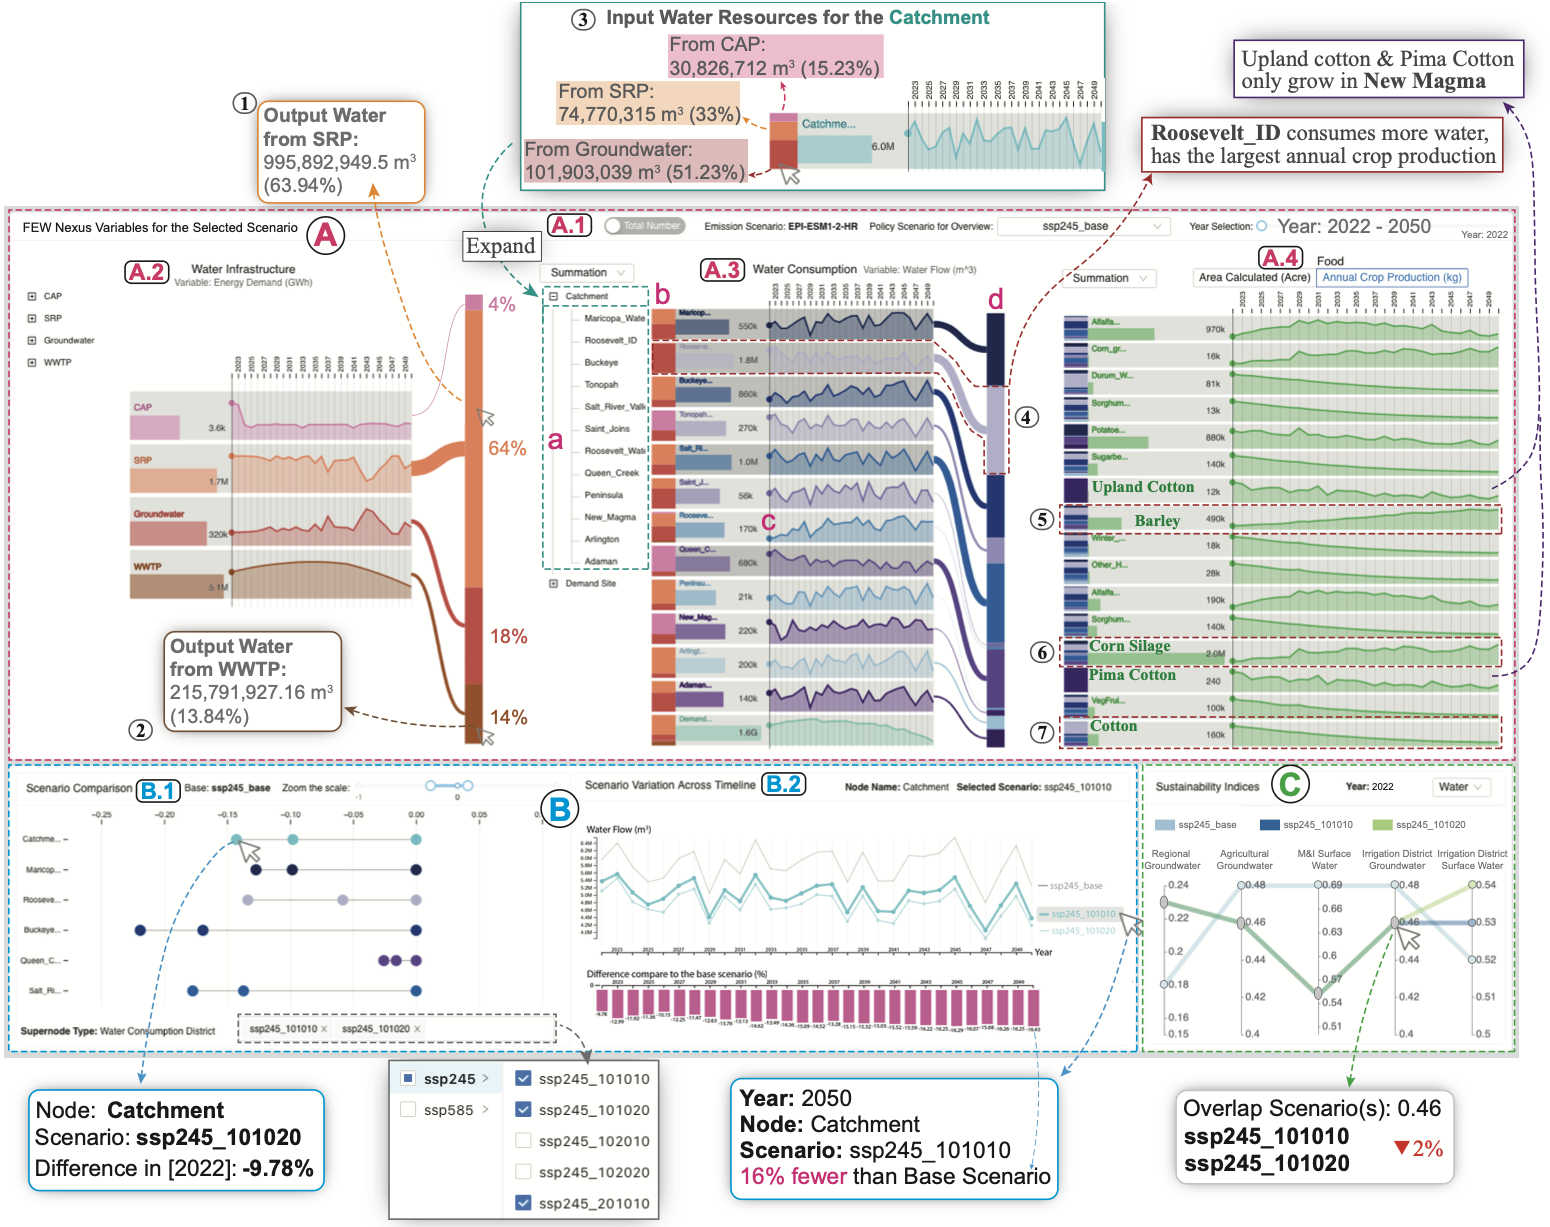
The interdependencies of food, energy, and water (FEW) systems create a nexus opportunity to explore the strengths and vulnerabilities of individual and cross-sector interactions within FEW systems. However, the variables quantifying nexus interactions are hard to observe, which hinders the cross-sector analysis. To overcome such challenges, we present FEWSim, a visual analytics framework designed to support domain experts in exploring and interpreting simulation results from a coupled FEW model. FEWSim employs a three-layer asynchronous architecture: the model layer integrates food, energy, and water models to simulate the FEW nexus; the middleware layer manages scenario configuration and execution; and the visualization layer provides interactive visual exploration of simulated time-series results across FEW sectors. The visualization layer further facilitates the exploration across multiple scenarios and evaluates scenario differences in performance using sustainability indices of the FEW nexus. We demonstrate the utility of FEWSim through a case study for the Phoenix Active Management Area (AMA) in Arizona.
FEWSim: A Visual Analytic Framework for Exploring the Nexus of Food-Energy-Water Simulations
Fan Lei, David A. Sampson, Jiayi Hong, Yuxin Ma, Giuseppe Mascaro, Dave White, Rimjhim Agarwal, Ross Maciejewski
IEEE Computer Graphics and Applications (CG&A), to appear 2025
The interdependencies of food, energy, and water (FEW) systems create a nexus opportunity to explore the strengths and vulnerabilities of individual and cross-sector interactions within FEW systems. However, the variables quantifying nexus interactions are hard to observe, which hinders the cross-sector analysis. To overcome such challenges, we present FEWSim, a visual analytics framework designed to support domain experts in exploring and interpreting simulation results from a coupled FEW model. FEWSim employs a three-layer asynchronous architecture: the model layer integrates food, energy, and water models to simulate the FEW nexus; the middleware layer manages scenario configuration and execution; and the visualization layer provides interactive visual exploration of simulated time-series results across FEW sectors. The visualization layer further facilitates the exploration across multiple scenarios and evaluates scenario differences in performance using sustainability indices of the FEW nexus. We demonstrate the utility of FEWSim through a case study for the Phoenix Active Management Area (AMA) in Arizona.
2024
Understanding Reader Takeaways in Thematic Maps Under Varying Text, Detail, and Spatial Autocorrelation
Arlen Fan*, Fan Lei*, Michelle Mancenido, Alan M. MacEachren, Ross Maciejewski (* equal contribution)
Proceedings of the CHI Conference on Human Factors in Computing Systems (CHI 2024) 2024
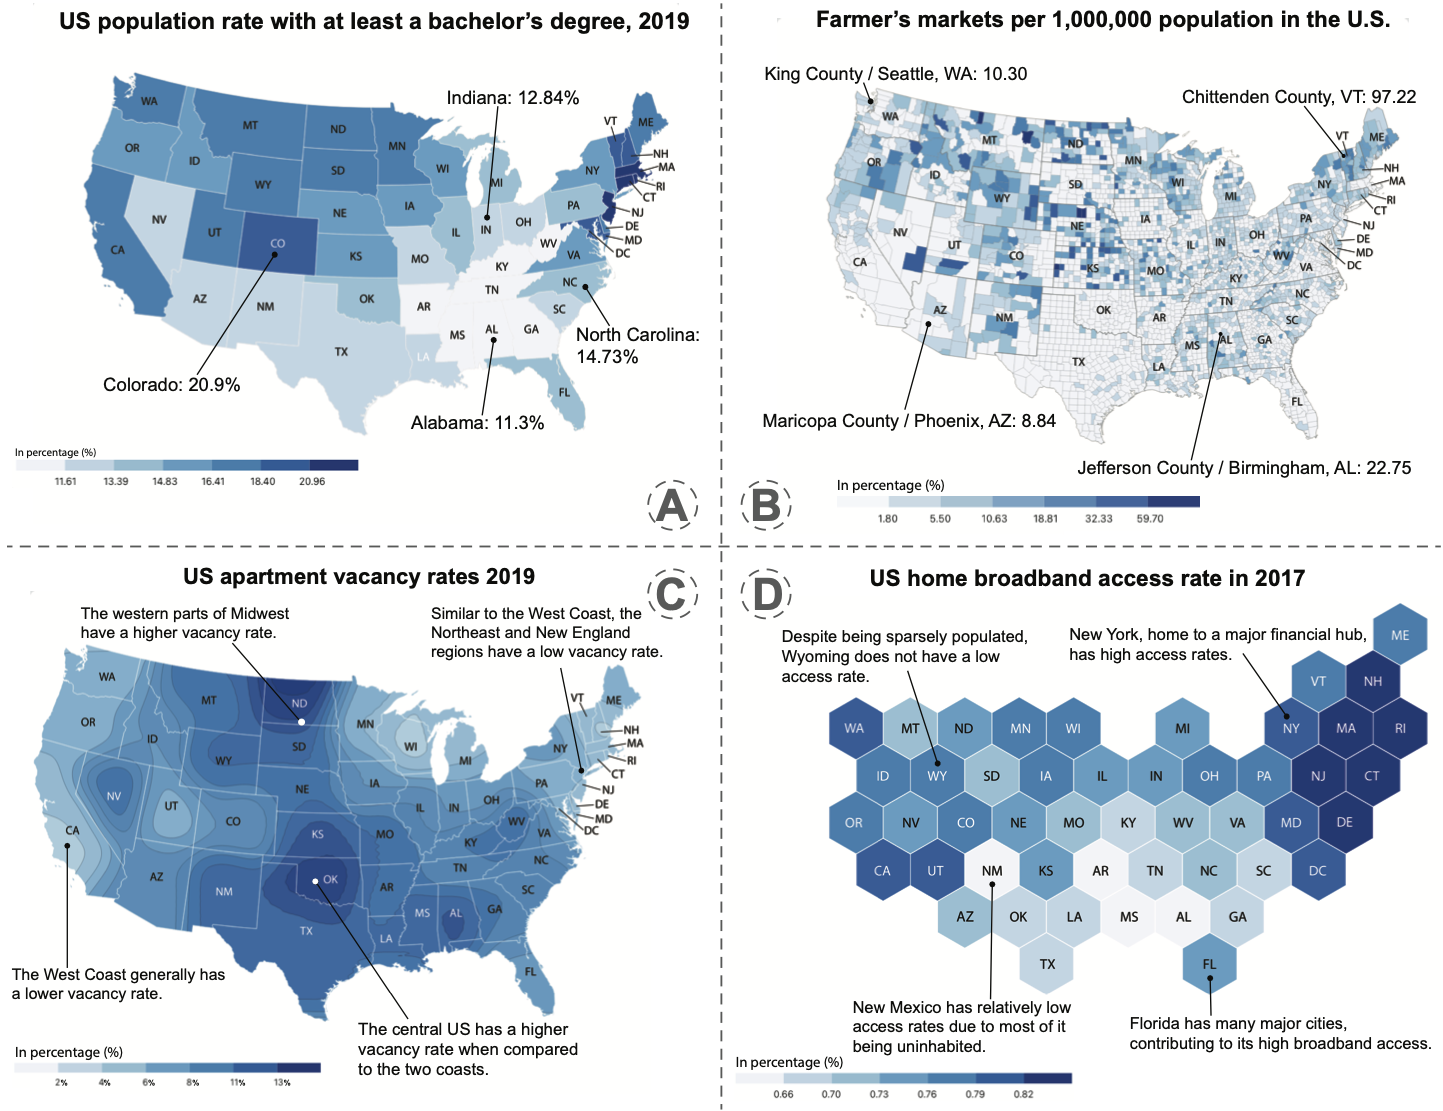
Maps are crucial in conveying geospatial data in diverse contexts such as news and scientific reports. This research, utilizing thematic maps, probes deeper into the underexplored intersection of text framing and map types in influencing map interpretation. In this work, we conducted experiments to evaluate how textual detail and semantic content variations affect the quality of insights derived from map examination. We also explored the influence of explanatory annotations across different map types (e.g., choropleth, hexbin, isarithmic), base map details, and changing levels of spatial autocorrelation in the data. From two online experiments with $N = 103$ participants, we found that annotations, their specific attributes, and map type used to present the data significantly shape the quality of takeaways. Notably, we found that the effectiveness of annotations hinges on their contextual integration. These findings offer valuable guidance to the visualization community for crafting impactful thematic geospatial representations.
Understanding Reader Takeaways in Thematic Maps Under Varying Text, Detail, and Spatial Autocorrelation
Arlen Fan*, Fan Lei*, Michelle Mancenido, Alan M. MacEachren, Ross Maciejewski (* equal contribution)
Proceedings of the CHI Conference on Human Factors in Computing Systems (CHI 2024) 2024
Maps are crucial in conveying geospatial data in diverse contexts such as news and scientific reports. This research, utilizing thematic maps, probes deeper into the underexplored intersection of text framing and map types in influencing map interpretation. In this work, we conducted experiments to evaluate how textual detail and semantic content variations affect the quality of insights derived from map examination. We also explored the influence of explanatory annotations across different map types (e.g., choropleth, hexbin, isarithmic), base map details, and changing levels of spatial autocorrelation in the data. From two online experiments with $N = 103$ participants, we found that annotations, their specific attributes, and map type used to present the data significantly shape the quality of takeaways. Notably, we found that the effectiveness of annotations hinges on their contextual integration. These findings offer valuable guidance to the visualization community for crafting impactful thematic geospatial representations.
2023
GeoExplainer: A Visual Analytics Framework for Spatial Modeling Contextualization and Report Generation
Fan Lei, Yuxin Ma, A. Stewart Fotheringham, Elizabeth A. Mack, Ziqi Li, Mehak Sachdeva, Sarah Bardin, Ross Maciejewski
IEEE Transactions on Visualization and Computer Graphics (IEEE VIS 2023) 2023
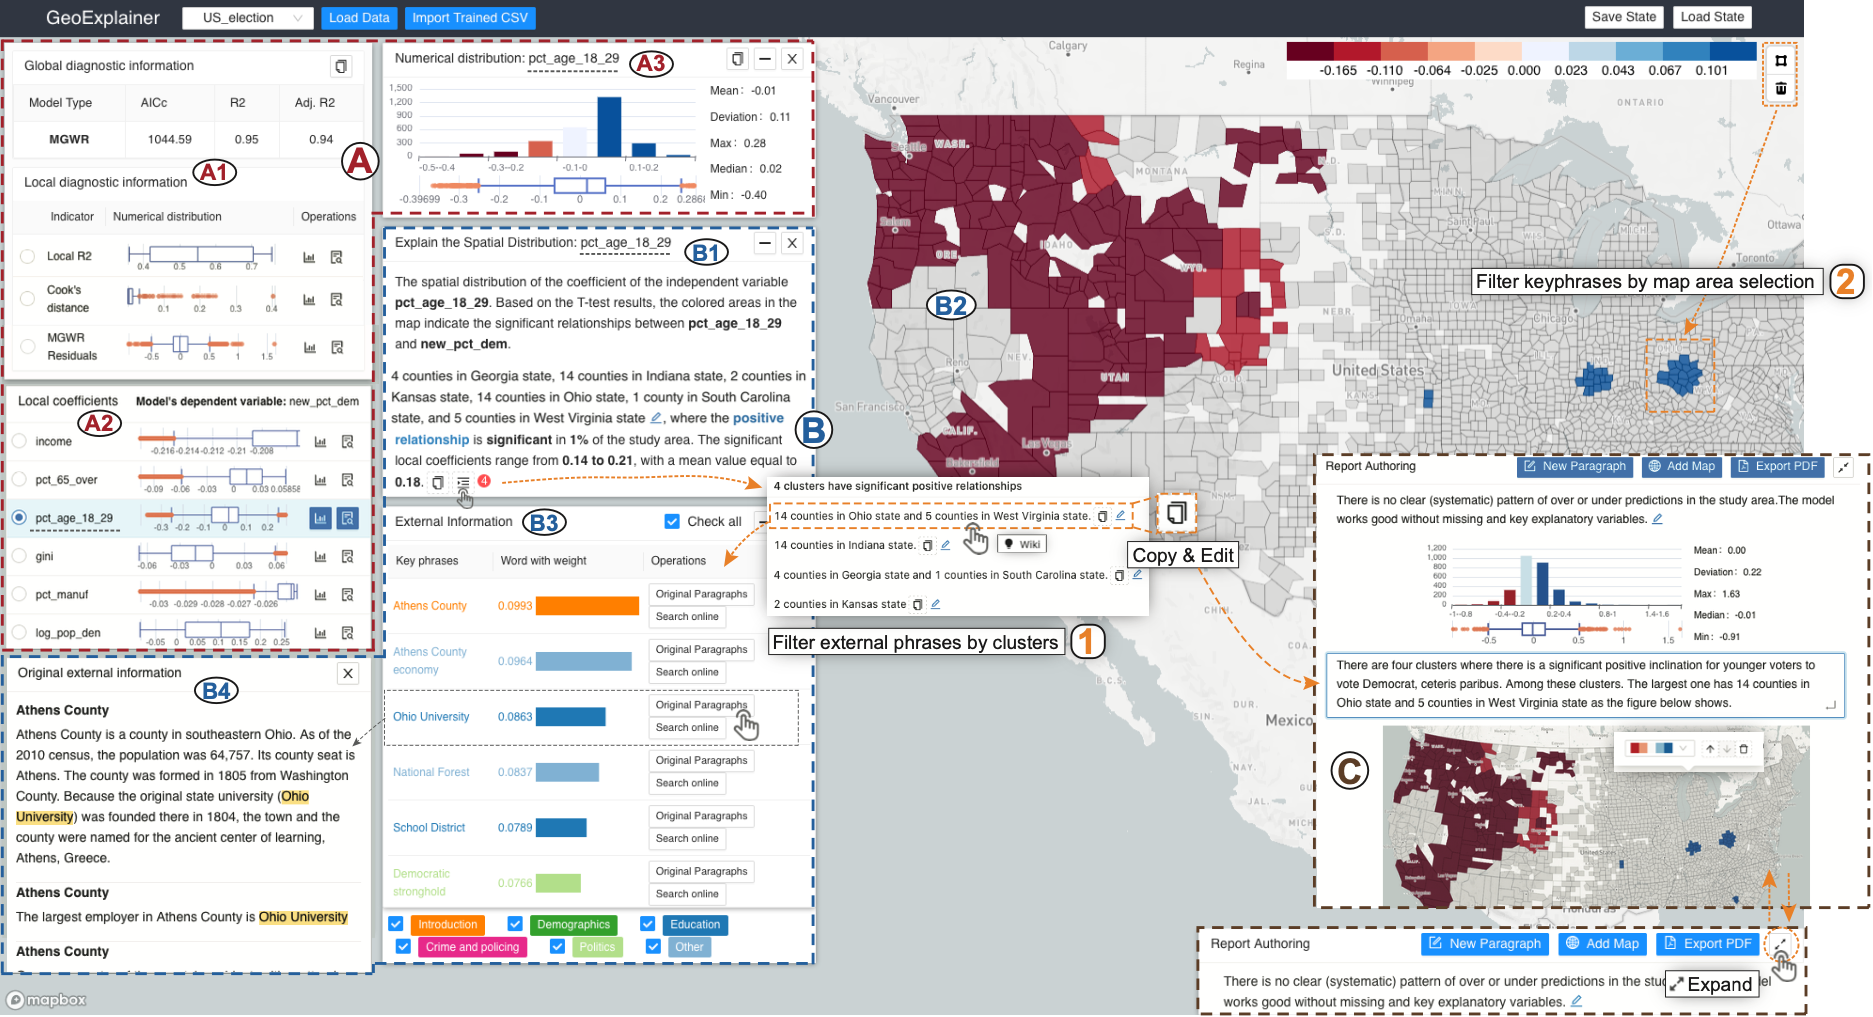
Geographic regression models of various descriptions are often applied to identify patterns and anomalies in the determinants of spatially distributed observations. These types of analyses focus on answering why questions about underlying spatial phenomena, e.g., why is crime higher in this locale, why do children in one school district outperform those in another, etc.? Answers to these questions require explanations of the model structure, the choice of parameters, and contextualization of the findings with respect to their geographic context. This is particularly true for local forms of regression models which are focused on the role of locational context in determining human behavior. In this paper, we present GeoExplainer, a visual analytics framework designed to support analysts in creating explanative documentation that summarizes and contextualizes their spatial analyses. As analysts create their spatial models, our framework flags potential issues with model parameter selections, utilizes template-based text generation to summarize model outputs, and links with external knowledge repositories to provide annotations that help to explain the model results. As analysts explore the model results, all visualizations and annotations can be captured in an interactive report generation widget. We demonstrate our framework using a case study modeling the determinants of voting in the 2016 US Presidential Election.
GeoExplainer: A Visual Analytics Framework for Spatial Modeling Contextualization and Report Generation
Fan Lei, Yuxin Ma, A. Stewart Fotheringham, Elizabeth A. Mack, Ziqi Li, Mehak Sachdeva, Sarah Bardin, Ross Maciejewski
IEEE Transactions on Visualization and Computer Graphics (IEEE VIS 2023) 2023
Geographic regression models of various descriptions are often applied to identify patterns and anomalies in the determinants of spatially distributed observations. These types of analyses focus on answering why questions about underlying spatial phenomena, e.g., why is crime higher in this locale, why do children in one school district outperform those in another, etc.? Answers to these questions require explanations of the model structure, the choice of parameters, and contextualization of the findings with respect to their geographic context. This is particularly true for local forms of regression models which are focused on the role of locational context in determining human behavior. In this paper, we present GeoExplainer, a visual analytics framework designed to support analysts in creating explanative documentation that summarizes and contextualizes their spatial analyses. As analysts create their spatial models, our framework flags potential issues with model parameter selections, utilizes template-based text generation to summarize model outputs, and links with external knowledge repositories to provide annotations that help to explain the model results. As analysts explore the model results, all visualizations and annotations can be captured in an interactive report generation widget. We demonstrate our framework using a case study modeling the determinants of voting in the 2016 US Presidential Election.
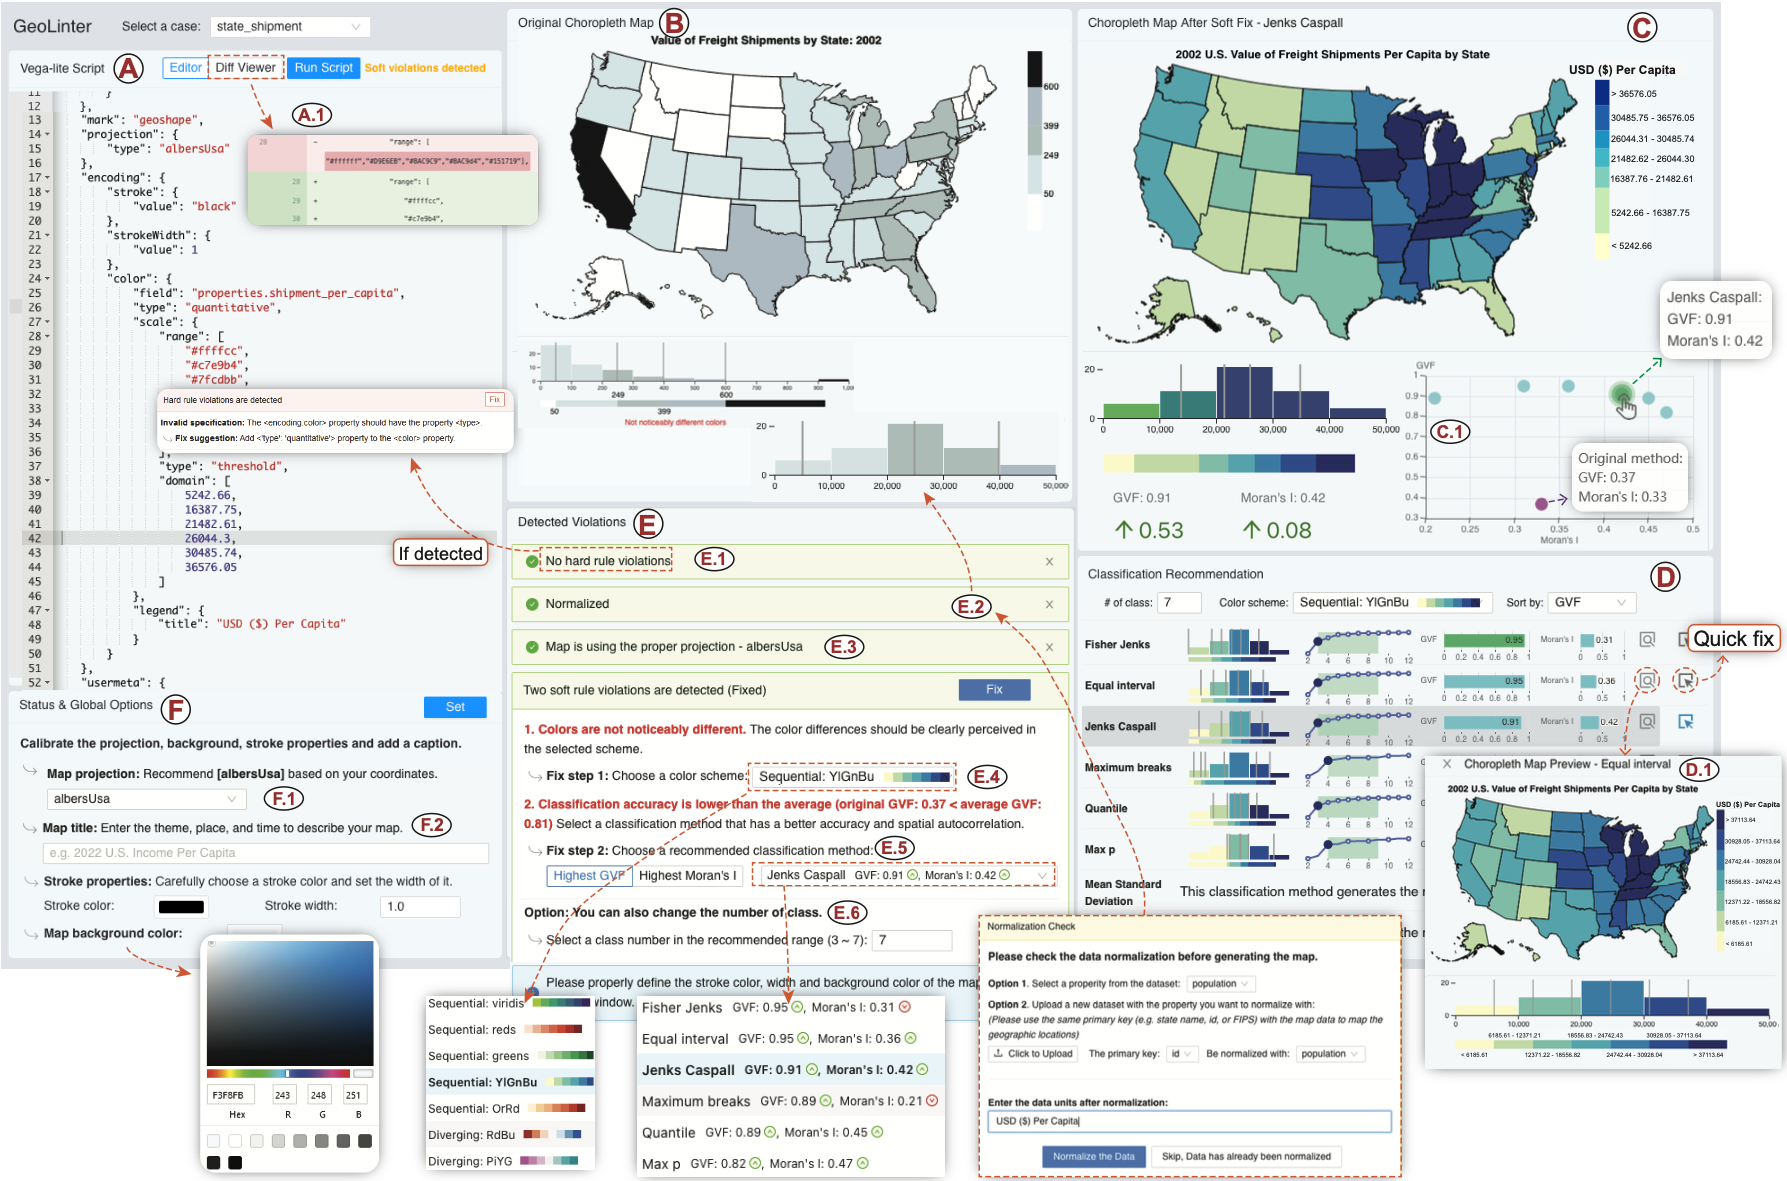
GeoLinter: A Linting Framework for Choropleth Maps
Fan Lei, Arlen Fan, Alan M. MacEachren, Ross Maciejewski
IEEE Transactions on Visualization and Computer Graphics 2023
Visualization linting is a proven effective tool in assisting users to follow established visualization guidelines. Despite its success, visualization linting for choropleth maps, one of the most popular visualizations on the internet, has yet to be investigated. In this paper, we present GeoLinter, a linting framework for choropleth maps that assists in creating accurate and robust maps. Based on a set of design guidelines and metrics drawing upon a collection of best practices from the cartographic literature, GeoLinter detects potentially suboptimal design decisions and provides further recommendations on design improvement with explanations at each step of the design process. We perform a validation study to evaluate the proposed framework's functionality with respect to identifying and fixing errors and apply its results to improve the robustness of GeoLinter. Finally, we demonstrate the effectiveness of the GeoLinter - validated through empirical studies - by applying it to a series of case studies using real-world datasets.
2018
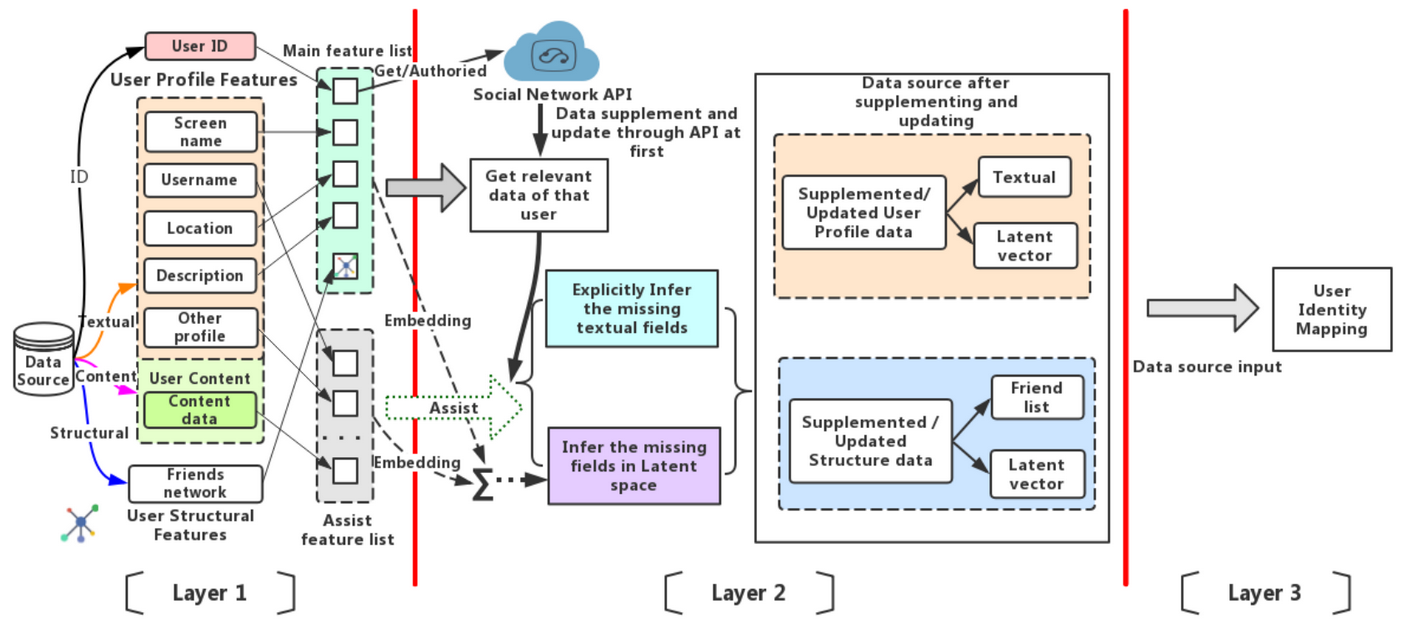
Catching Dynamic Heterogeneous User Data for Identity Linkage Learning
Fan Lei, Qiudan Li, Song Sun, Lei Wang, Daniel Dajun Zeng
International Joint Conference on Neural Networks (IJCNN 2018) 2018
Benefitting from the development of social platforms, more and more users tend to register multiple accounts on different social networks. Linking user identities across multiple online social networks based on user behavior patterns is considerable for network supervision and information tracking. However, a user's online behavior in a social network is dynamic. The user profile may be changed due to some specific reasons such as user migration or job changes. Thus, catching the dynamics of evolutionary user data and collecting the latest user features are important and challenging issues in the area of user identity linkage. Inspired by deep learning models such as word2vec and Deep Walk, this paper proposes an integrated framework to catch the dynamic user data by supplementing vacant features and updating outdated features in data sources. The framework firstly represents all textual and structural user data into Iow- dimensional latent spaces by utilizing word2vec and DeepWalk, then, integrates different user features and predicts vacant data fields based on late fusion approach and cosine similarity computation. We then explore and evaluate the application of our proposed method in a user identity mapping task. The results proved that our framework can successfully catch the dynamic user data and enhance the performance of identity linkage models by supplementing and updating data sources advance with the times.